Interactive Marker Selection
PicturedRocks provides an interactive user interface for selecting markers that allows the practitioner to use both their domain knowledge and the information-theoretic methods to select a small set of genes.
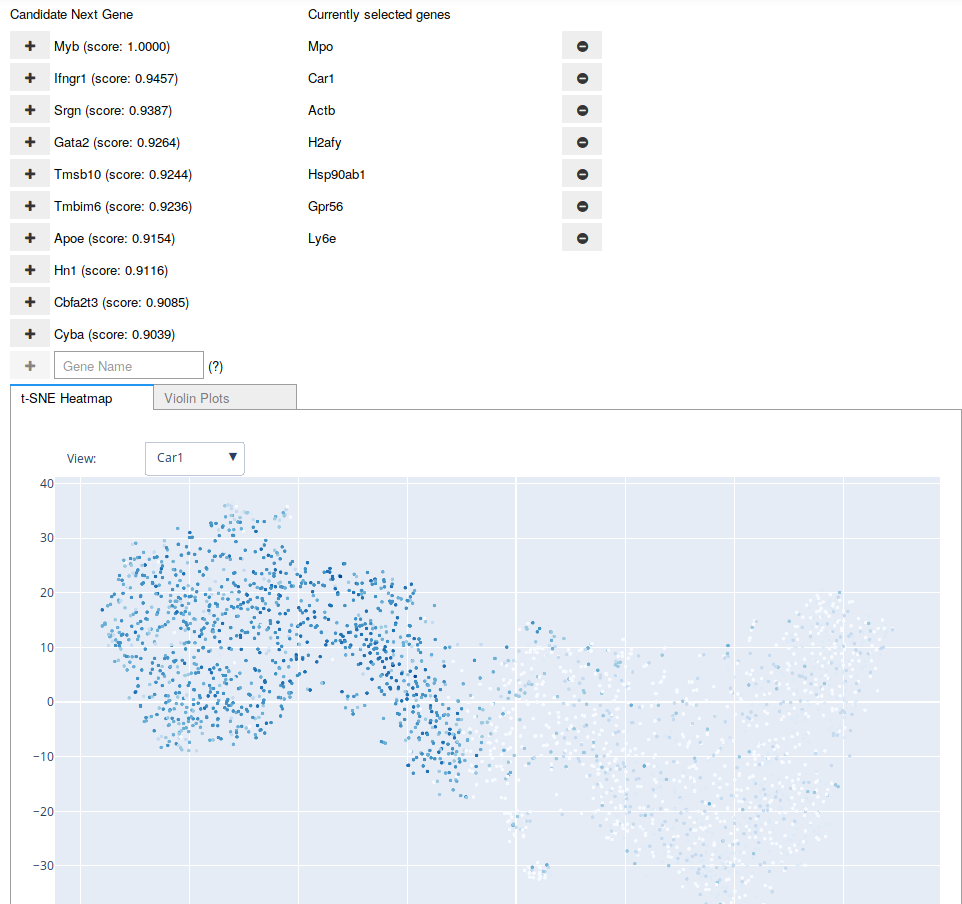
A screenshot of the Interactive Marker Selection user interface being used on the Paul dataset. The “candidate” genes are updated after any addition to or removal from the “current” list of genes. The user may also type in the name of a gene at any point.
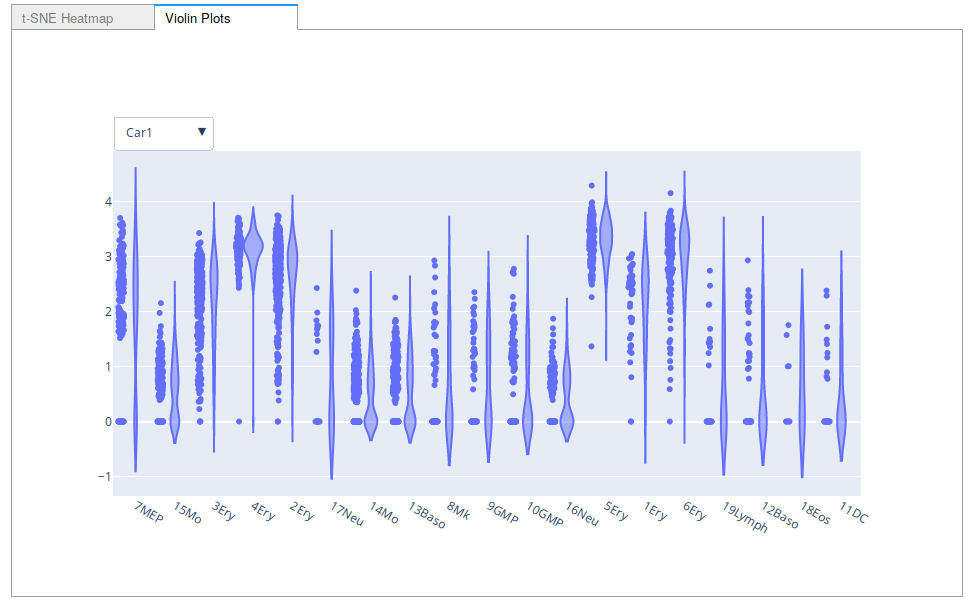
A screenshot of the violin plot option for Interactive Marker Selection.
The user can specify the tabs they want available through the visuals argument. It is also possible to write your own interface for a tab using any plotting library available to you. See below for more details.
-
class
picturedrocks.markers.interactive.InteractiveMarkerSelection(adata, feature_selection, visuals=None, disp_genes=10, connected=True)¶ Run an interactive marker selection GUI inside a jupyter notebook
Parameters: - adata (anndata.AnnData) – The data to run marker selection on. If you want to restrict to a small number of genes, slice your anndata object.
- feature_selection (picturedrocks.markers.mutualinformation.iterative.IterativeFeatureSelection) – An instance of a interative feature selection algorithm class that corresponds to adata (i.e., the column indices in feature_selection should correspond to the column indices in adata)
- visuals (list) – List of visualizations to display. These can either be shorthands for built-in visualizations (currently “tsne”, “umap”, and “violin”), or an instance of InteractiveVisualization (see GeneHeatmap and ViolinPlot for example implementations).
- disp_genes (int) – Number of genes to display as options (by default, number of genes plotted on the tSNE plot is 3 * disp_genes, but can be changed by setting the plot_genes property after initializing.
- connected (bool) – Parameter to pass to
plotly.offline.init_notebook_mode. If your browser does not have internet access, you should set this to False.
Warning
This class requires modules not explicitly listed as dependencies of picturedrocks. Specifically, please ensure that you have ipywidgets installed and that you use this class only inside a jupyter notebook.
-
redraw()¶ Redraw jupyter widgets after a change
This is called internally and there should usually be no need for the user to explicitly call this method.
-
show()¶ Display the jupyter widgets
-
class
picturedrocks.markers.interactive.GeneHeatmap(dim_red='tsne', n_pcs=30)¶ GeneHeatmap for Interactive Marker Selection
Parameters:
-
class
picturedrocks.markers.interactive.ViolinPlot¶ Violin Plots for each class label
Using Your Own Visualizations
To write your own visualization, simply extend the InteractiveVisualization. Use the source code for GeneHeatmap and ViolinPlot as a reference for implementation.
-
class
picturedrocks.markers.interactive.InteractiveVisualization¶ Abstract base class for interactive visualizations
Extend this class and pass an instance of it to InteractiveMarkerSelection to use your own visualization. It is recommended that you begin your implementation of
__init__with:super().__init__()
You are welcome to add parameters specific to your visualization in the
__init__method.-
prepare(adata, out)¶ Prepare for visualization
This method is called when InteractiveMarkerSelection is initialized. It is recommended that you begin your implementation with
super().prepare(adata, out)
This stores adata and out in
self.adataandself.outrespectively.
-
redraw(next_gene_inds, cur_gene_inds)¶ Draw the visualization
You must implement this method. To display the plots in the appropriate widget, use:
with self.out:
    fig.show() # or your plotting library's equivalent
-
title¶ Title of the visualization
This should be a Python property, using the
@propertydecorator.
-